Spectral Energy Distribution, Light Curves etc
Spectral Energy Distribution (SED)
Gamma-ray SED of the core of Centaurus A. Fermi-LAT (open circles) and H.E.S.S. (filled circles) data points along with a high-energy power-law extrapolation of the gamma-ray spectrum measured below the break energy:
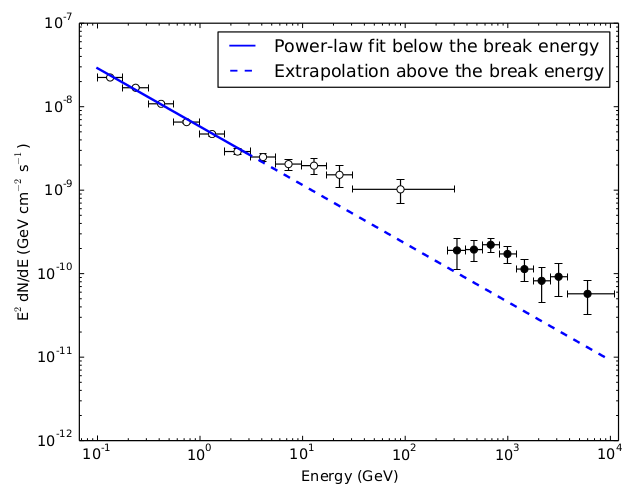
Source: 2018, H.E.S.S. Collaboration, MPI link
Overall SED of the core of Centaurus A with models. The red curve corresponds to a SSC component designed to fit the radio to sub-GeV data. The blue curve corresponds to a second SSC component added to account for the highest-energy data. The black curve corresponds to the sum of the two components. SED points as derived from H.E.S.S. and Fermi-LAT data are shown with open circles:
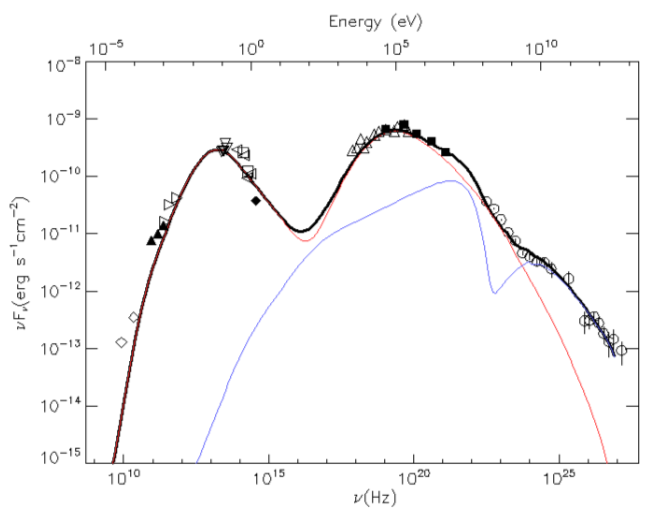
Source: 2018, H.E.S.S. Collaboration, MPI link
SED including data from the NASA/IPAC Extragalactic Database (NED) and somewhat more recent H.E.S.S. data:
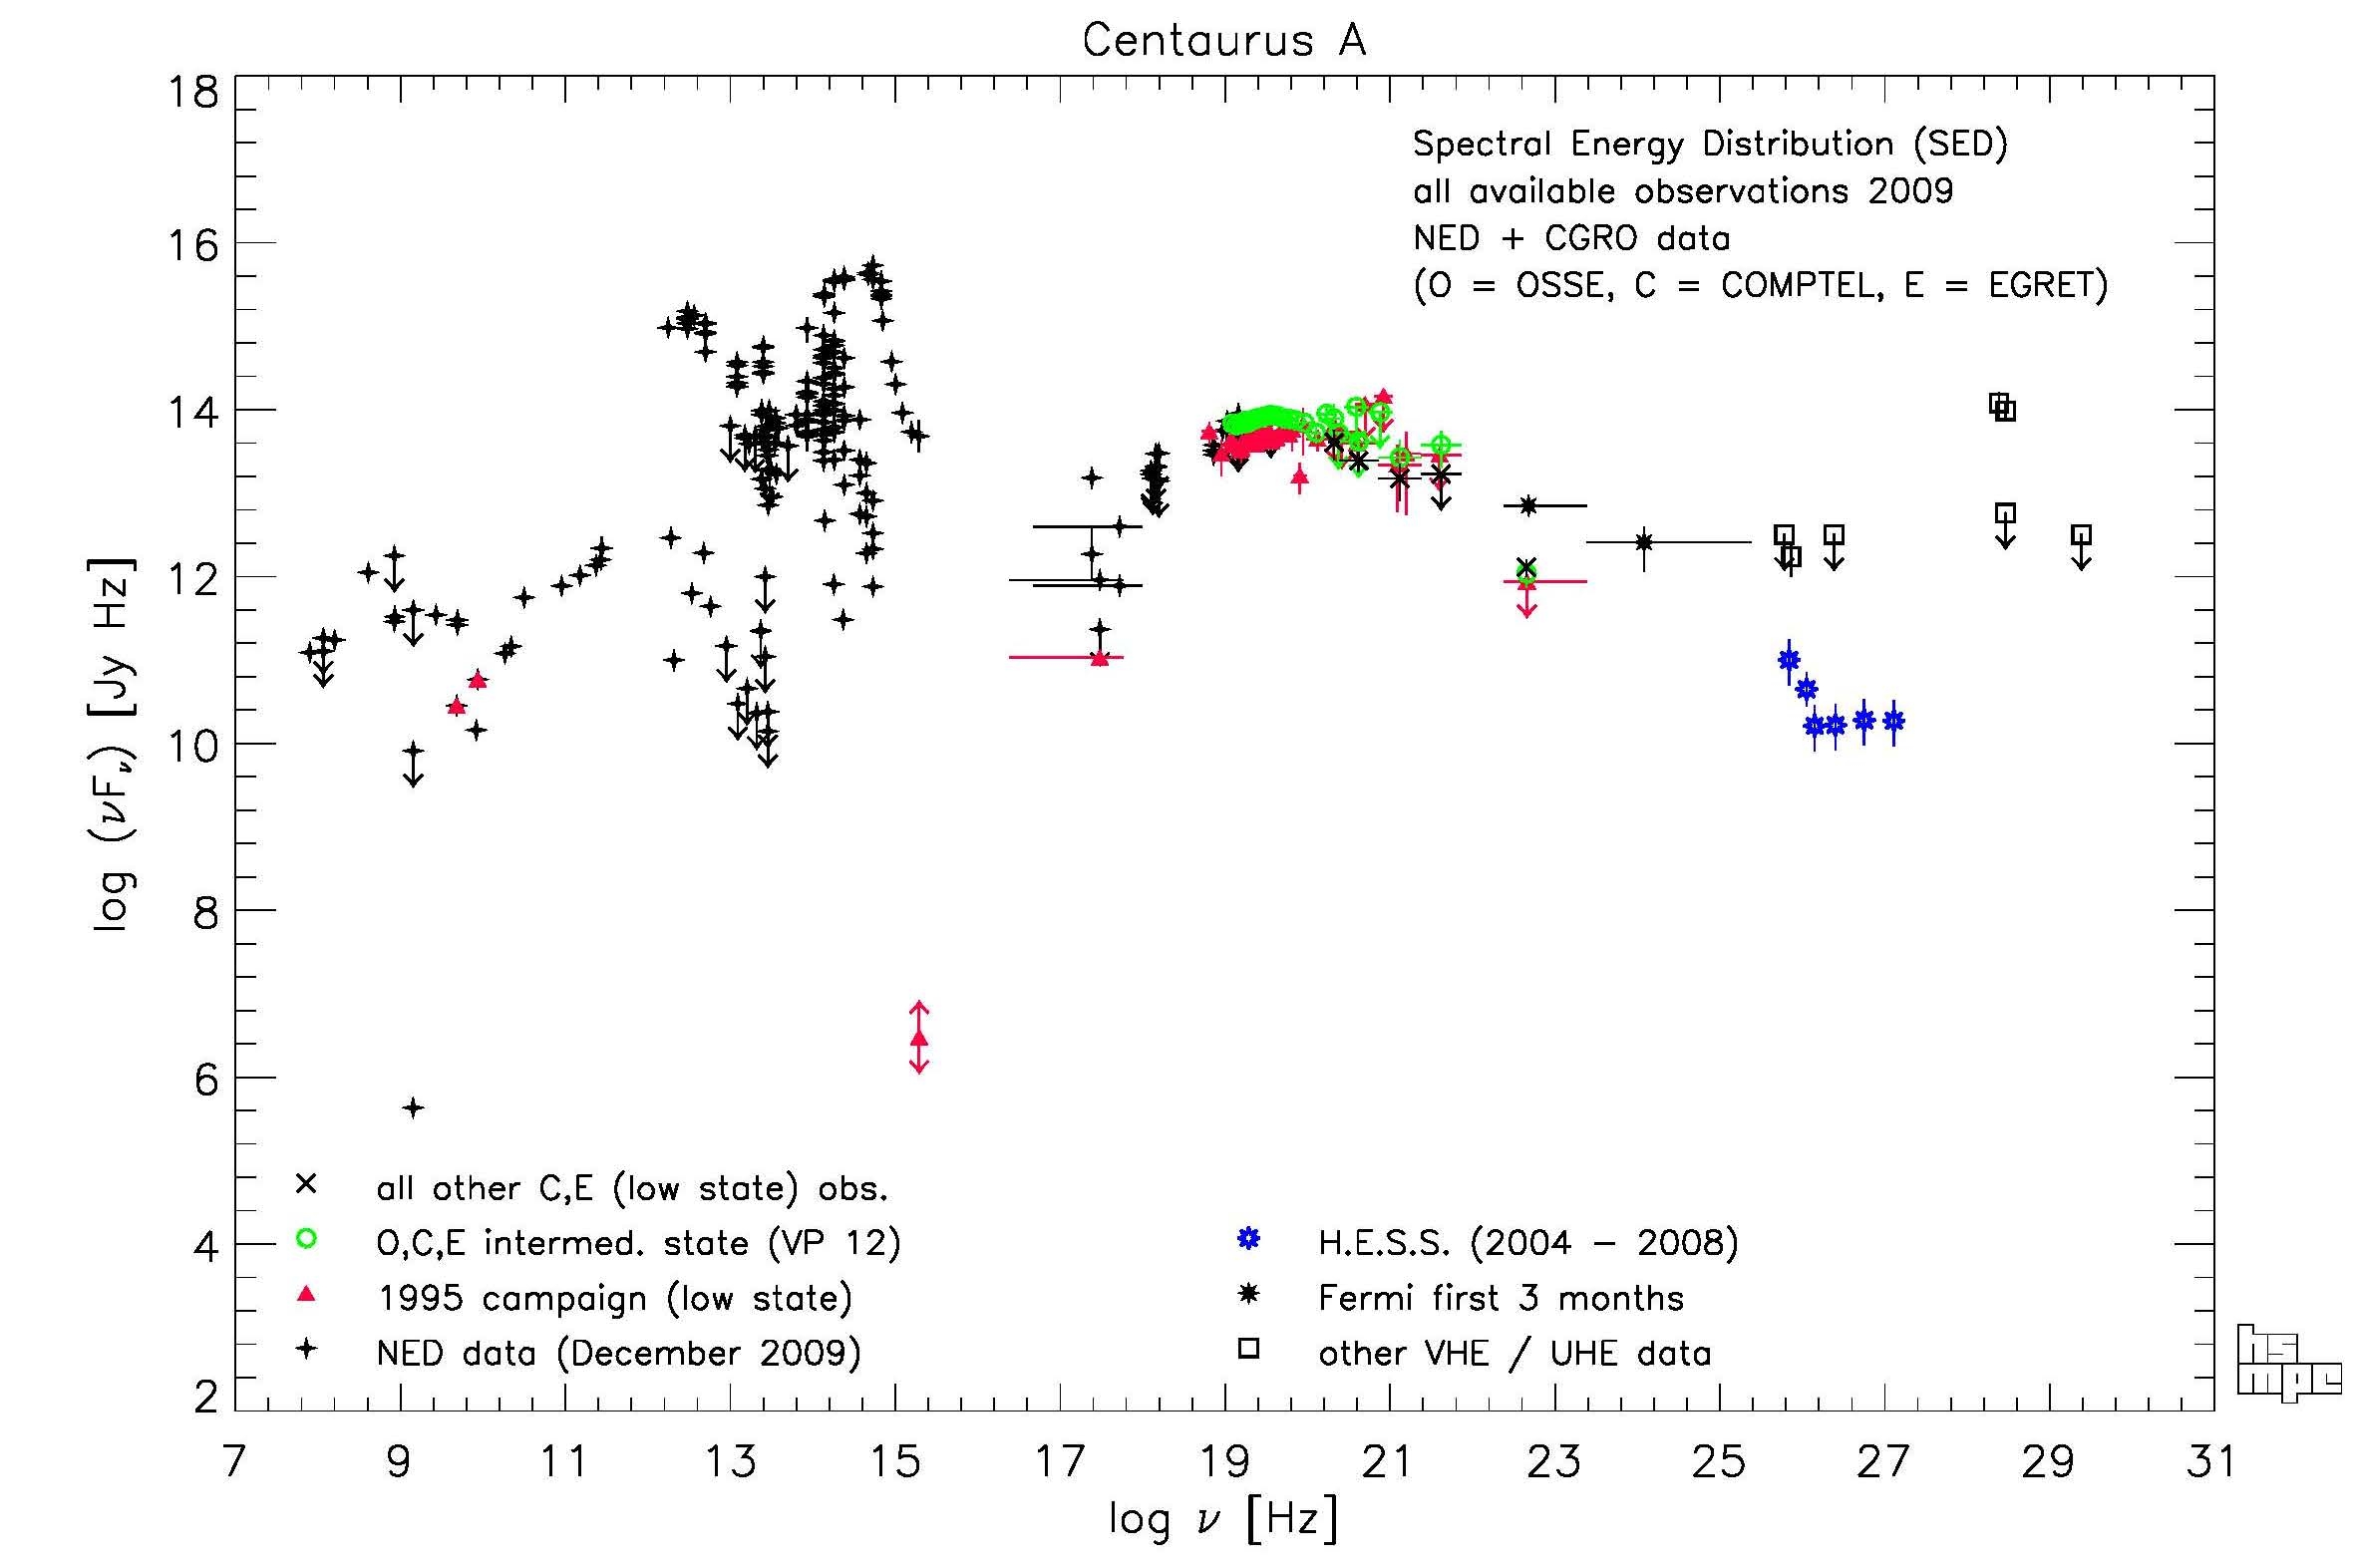
The SED data from CGRO are listed in section 'CGRO data points'
of the page
HS' observations
SED from contemporaneous data obtained during a campaign in July 1995
(Steinle et al. 1999, Steinle 2001a, Steinle 2001b)
(Note that an error in the ROSAT and EGRET data points has been corrected):
SED and flux density of the entire source, from low-frequency radio to low-energy gamma ray.
Figures based on measurements listed on the NED/IPAC website, complemented with DIRBE, WMAP and PLANCK fluxes, and a number of radio continuum measurements from 1960s to 1980s not listed by NED/IPAC:
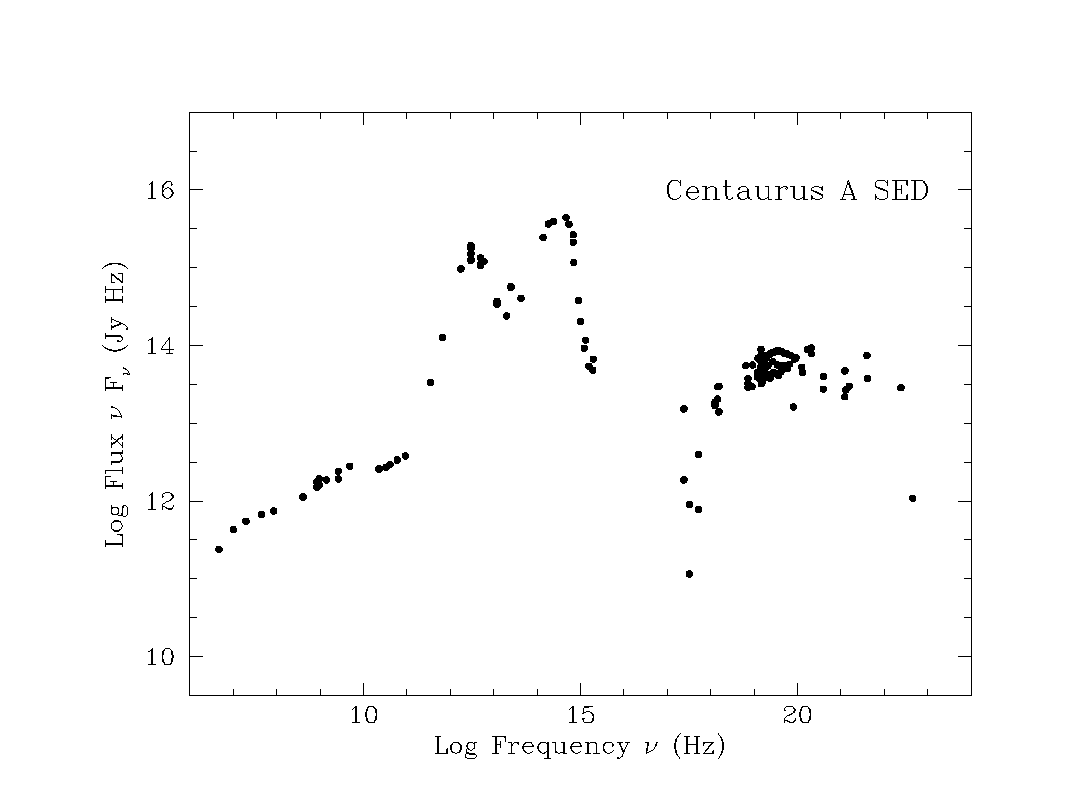
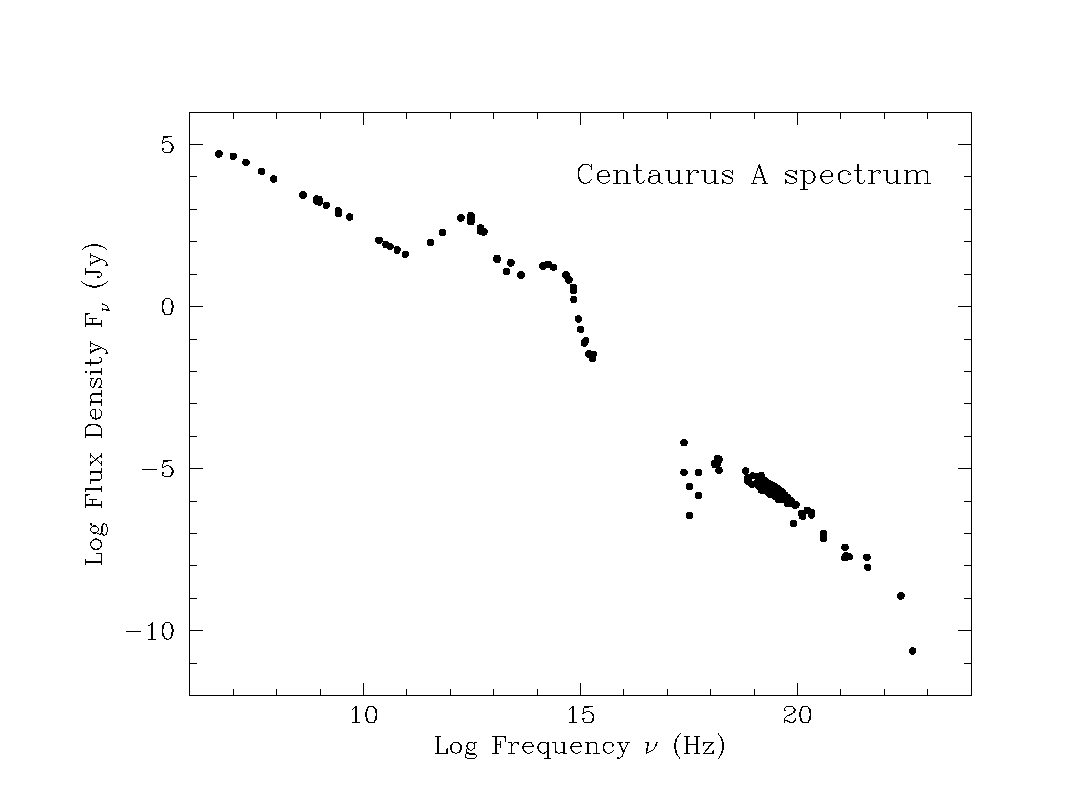
Credit: F. P. Israel
10 Year Vela 5b Light Curve at 1 - 12 keV (1969 - 1979)
From J. Terrell (1986)
26 Year Light Curve at 3 - 12 keV (1969 - 1994)
Compilation from Turner et al. (1997)
Long Term Light Curve at ∼100 keV (1968 to 1995)
Fig. 5 from Bond et al. (1996)
This light curve overlaps with the CGRO-BATSE light curve (see below)
for almost 4 years (May 1991 to end 1995) and the persistent
'low state' of Cen A since 1993 is evident.
CGRO-Batse Light Curve at 20 - 200 keV (29-04-1991 to 25-05-2000)
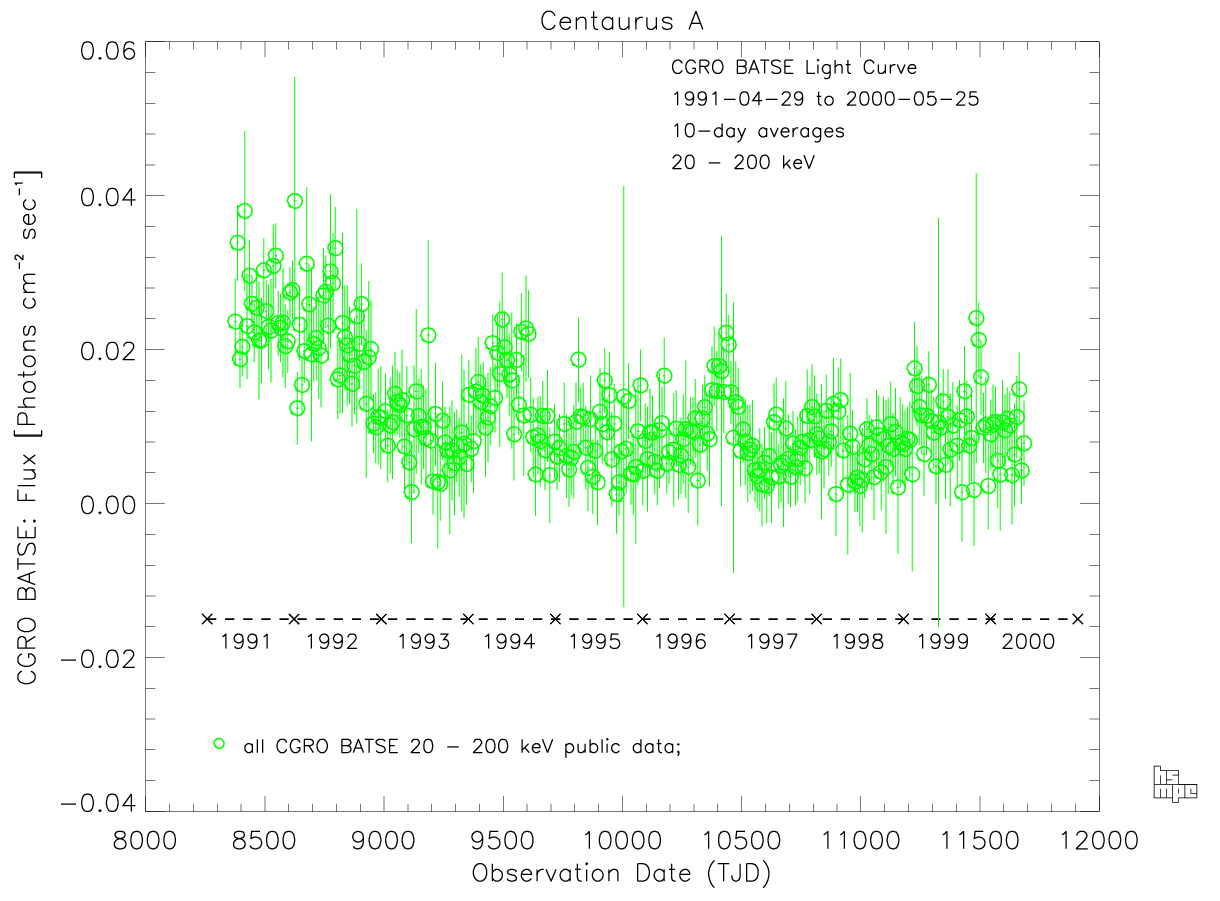
Compton Gamma-Ray Observatory (CGRO) BATSE Cen A monitoring data available
up to TJD 11690 (25-05-2000, the day all scientific instruments aboard CGRO
were switched off prior to the deliberate destruction of the Compton Gamma-Ray
Observatory by NASA). The light curve overlaps with the RXTE-ASM light curve
(see below) for almost 4.5 years (January 1996 to May 2000) and the persistent
'low state' of Cen A is evident.
RXTE-ASM Light Curve at 2 - 10 keV (05-01-1996 to 24-08-2011)
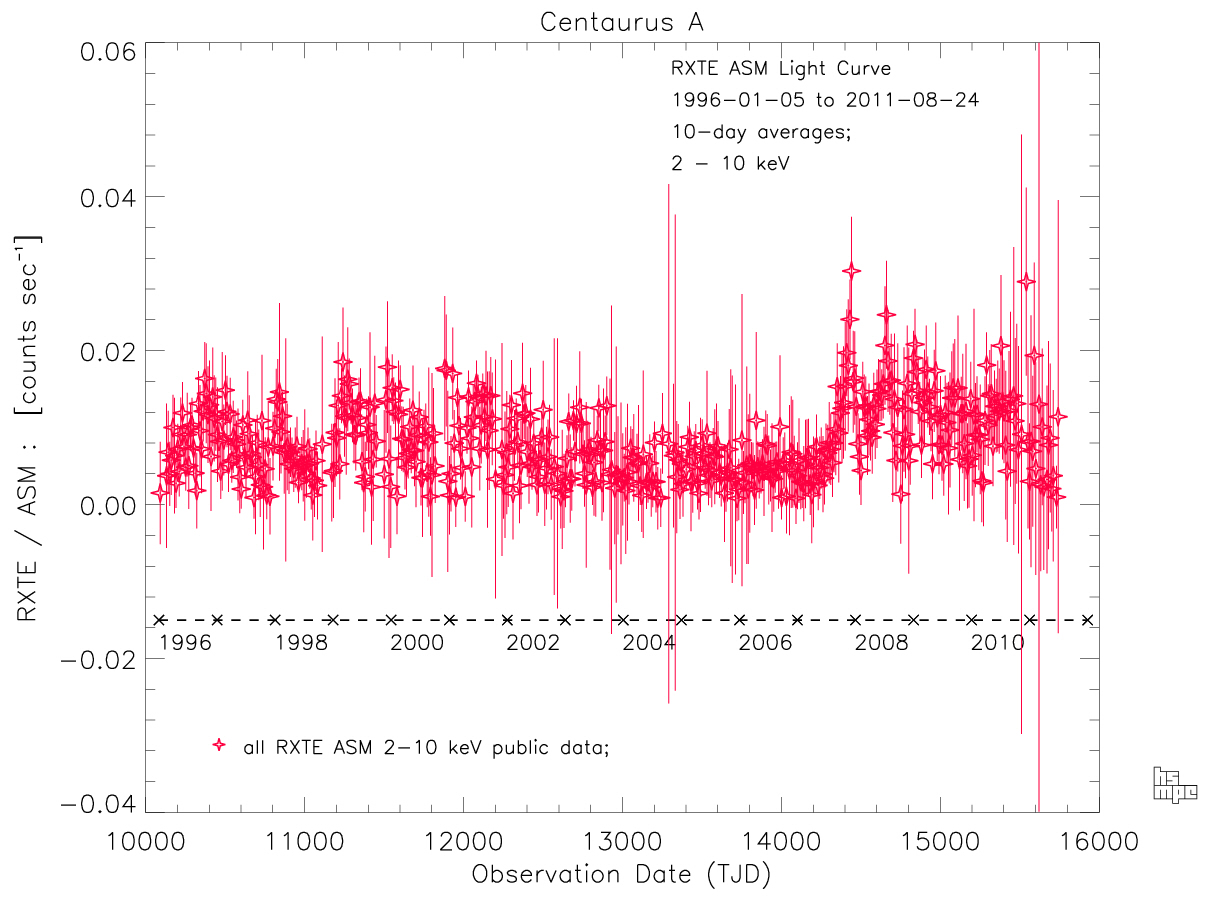
All Rossi X-ray Timing Explorer (RXTE) All-Sky Monitor (ASM) Cen A data
available up to TJD 15797 (24-08-2011) about 4 months before RXTE was shut
down on 5th January 2012 after a successful 16-year mission. The light curve
overlaps with the Swift-BAT light curve (see below) for almost 6.5 years
(May 2005 to August 2011) and the persistent 'low state' of Cen A is again
evident.
Note: Benlloch et al. (2001) remark that "...apparent fluctuations in the
(RXTE) ASM flux at the end of each year coinciding with the closest angular
separation between the sun to Cen A. This variability is due to scattering of
solar X-rays off the ASM collimators onto the ASM detectors and is not due to
source flux variations." (Remillard, private communication)
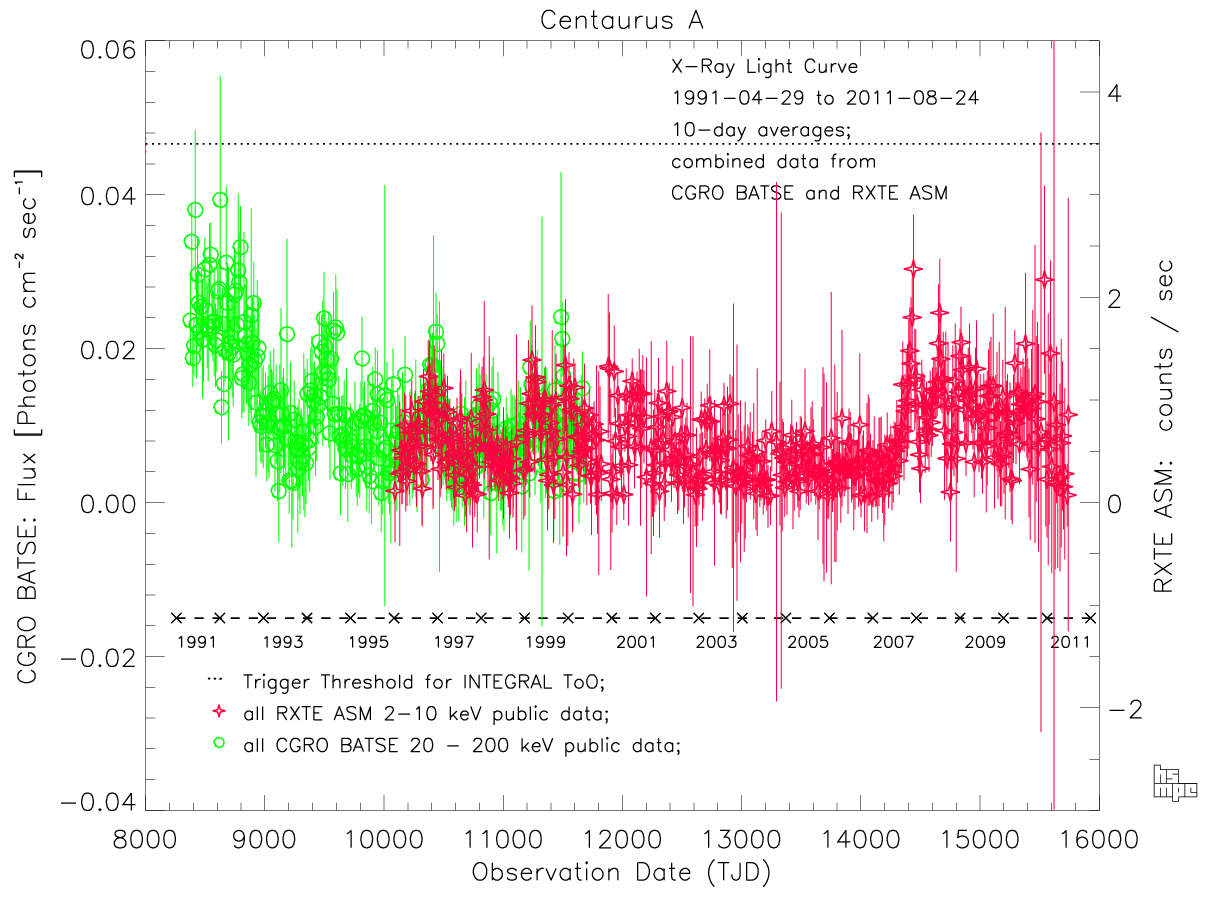
Combined CGRO-BATSE (20 - 200 keV) and RXTE-ASM (2 - 10 keV) Light Curve (29-04-1991 to 24-08-2011)
Swift-BAT Light Curve at 15 - 50 keV (14-05-2005 to 21-04-2015)
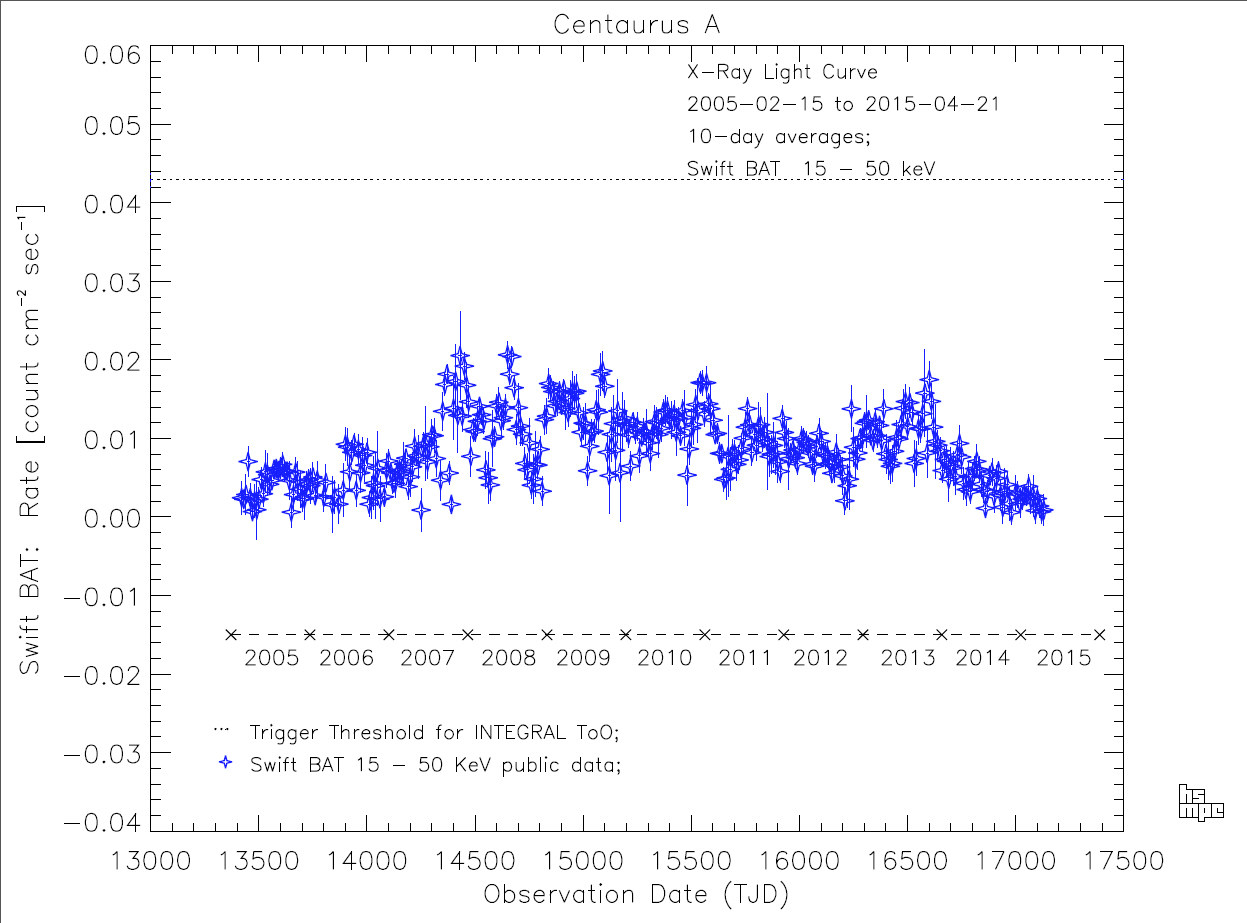
Swift Burst Alert Telescope (BAT) Cen A data up to TJD 17130 (21-04-2015).
The Swift mission is still operating and delivering data.